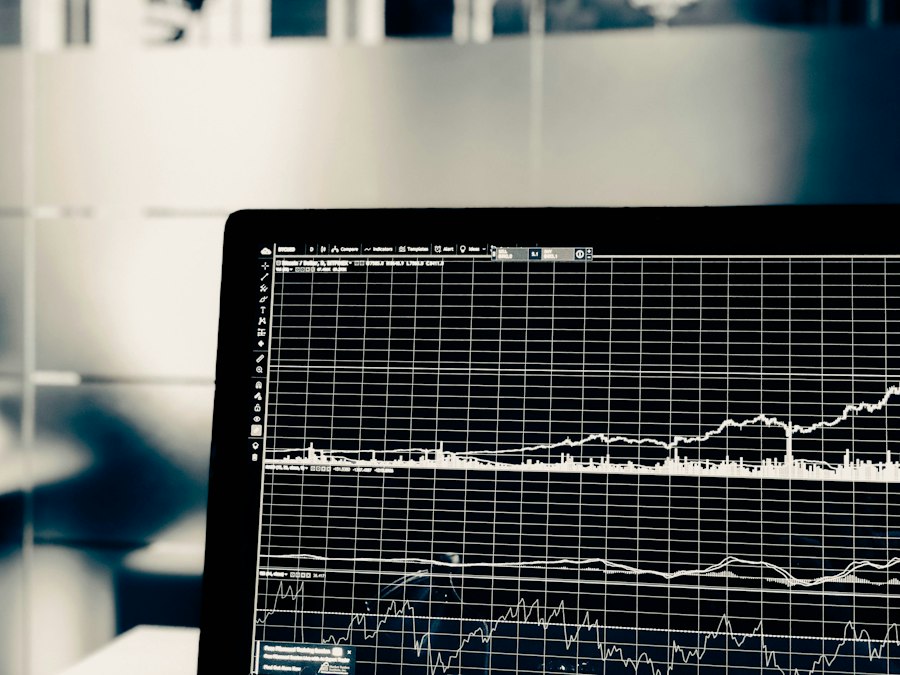
Equipment Comparison Report
Compare two or more rigs head-to-head with matched power supplies, pool endpoints, and ambient conditions.
Busan · Since 2019
We bench-test ASIC and GPU mining rigs rated at 0.05 TH/s and higher, recording variance over 72-hour runs so you can compare equipment before you commit capital.
What We Measure
Manufacturer spec sheets quote peak hash rates. We record what your rig actually sustains across temperature swings, voltage dips, and fan-curve changes. Our reports compare units side by side using the same power supply, ambient room, and pool endpoint.
Equipment Reviews
Compare two or more rigs head-to-head with matched power supplies, pool endpoints, and ambient conditions.
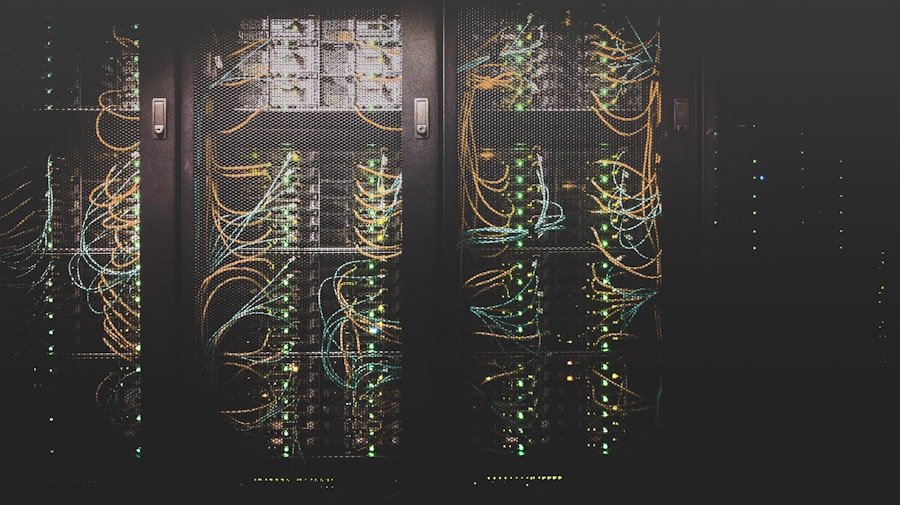
Our flagship service: a full stability run with thermal logging, fan-curve analysis, and a written report comparing sustained output against manufacturer claims.
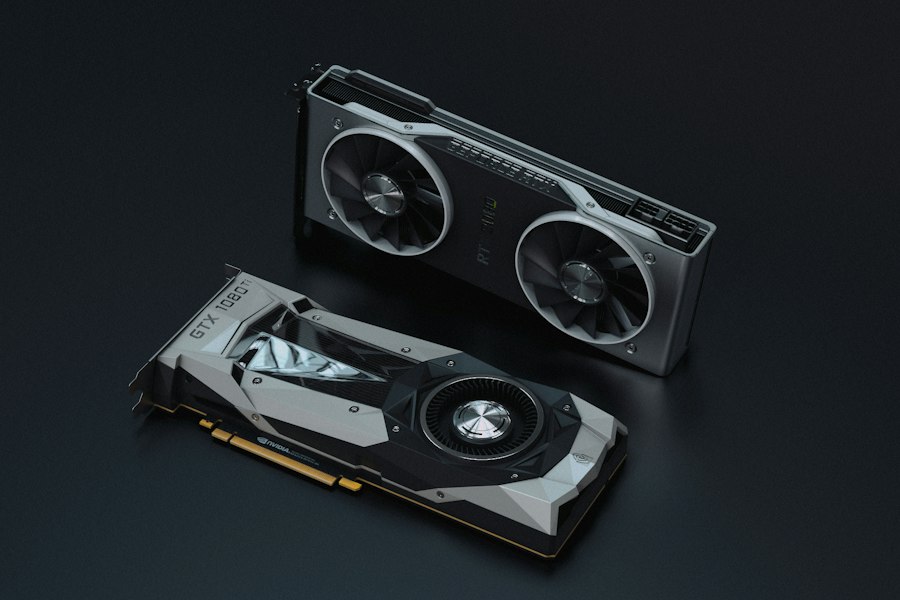
Field sampling of hash rate stability across your installed fleet, with thermal imaging and airflow notes.
From the Field
The stability report on our Antminer S19 batch showed a 4.2% drop during the second night when intake temps climbed past 34°C. We re-ducted the room before scaling to forty units — something the factory sheet never warned us about.
— Min-jun Park, small-scale host in Gyeonggi-do
Clear charts, no sales pitch. The comparison between two used L7 units saved us from buying the noisier one. Report arrived two days late, but the technician called ahead to explain the extended thermal cycle.
— Sarah Whitfield, independent miner, Jeju
Field Notes
Peak hash rate sells hardware. Variance determines whether that hardware pays for itself over a full season.

The minimum computing power where stability measurement produces reliable, actionable data.